Premise: "Cold nuclear fusion and LENR: one thousand nine hundred and ninety-nine ways not to do them"
Introduction: "Experiments on cold nuclear fusion and LENR"


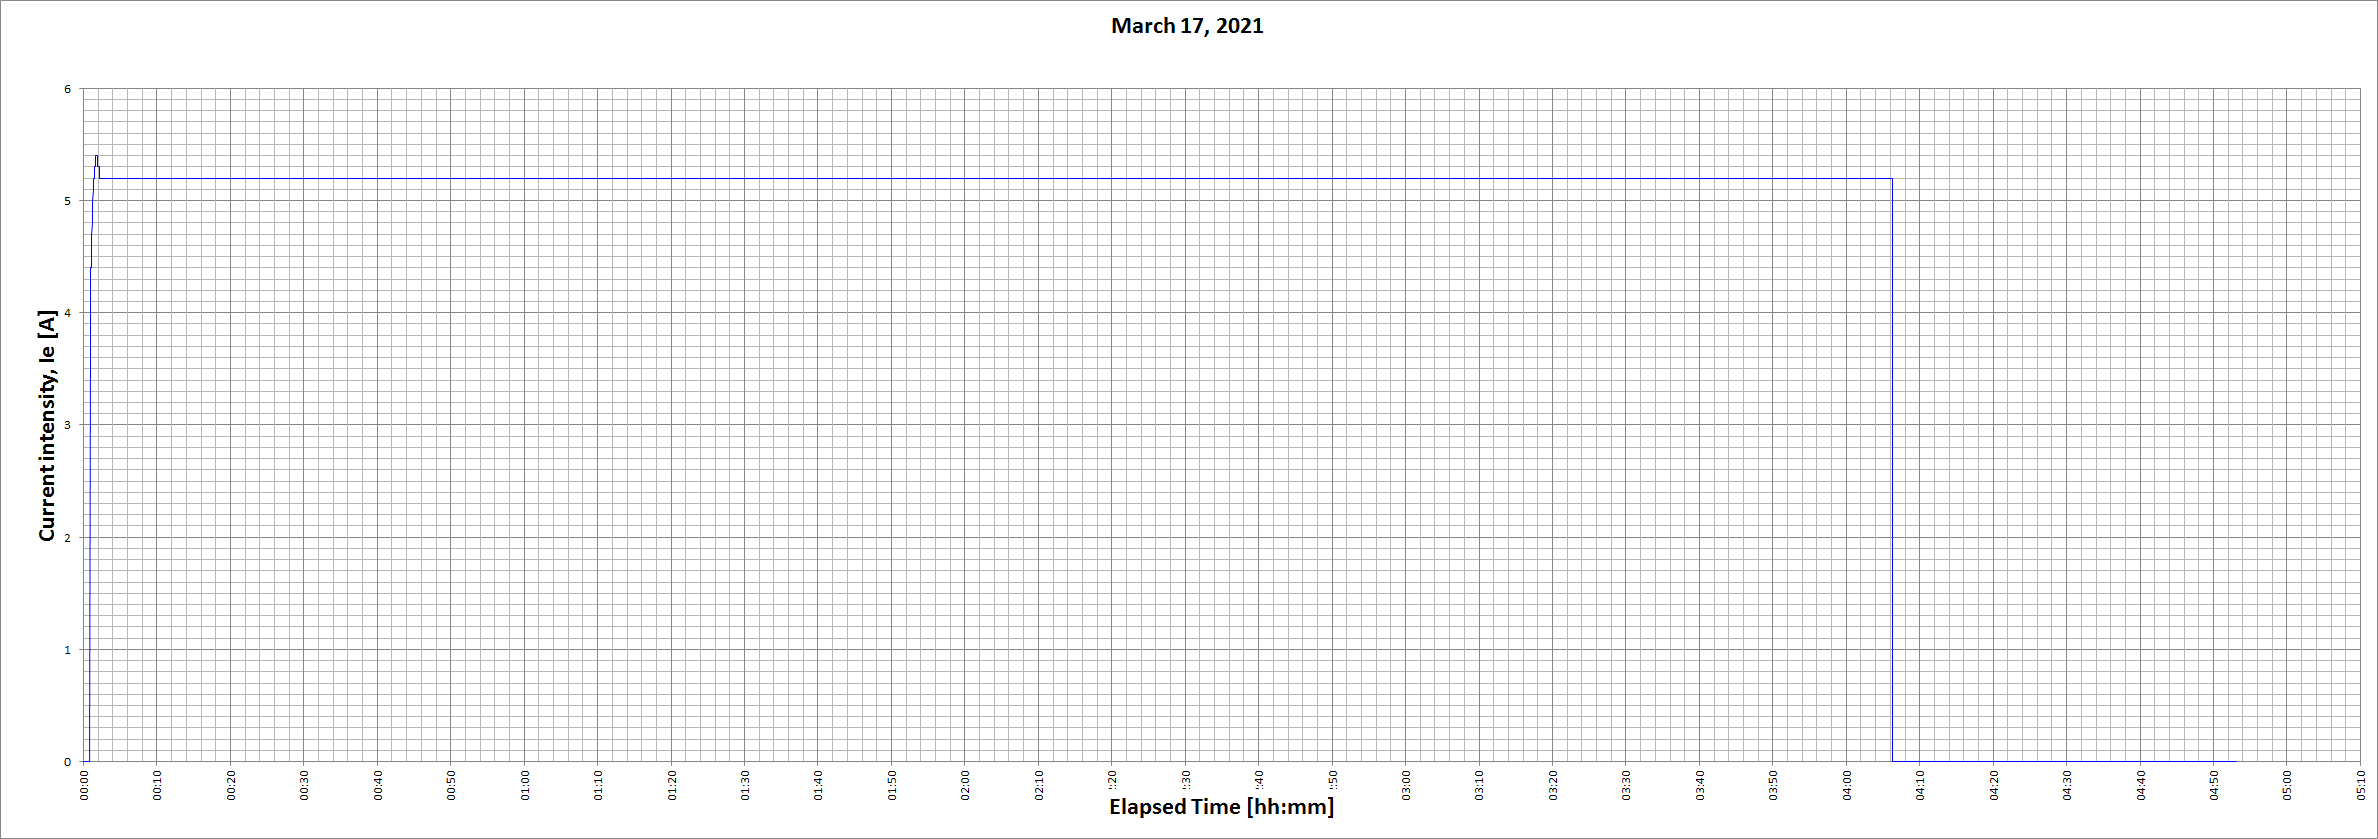
At the time 00:00:54 (hh:mm:ss) the switch that allows electrical power to reach the setup has been activated and the supply of current has started. At 04:06:15 the same switch was disabled and the power supply was interrupted. The power supply voltage was kept constant for the entire duration of the test while the current is free to vary (driving in voltage limitation). The graphs show that the current and consequently the electrical power increase, reach a maximum and then drop slightly in the first three minutes of delivery and then remain constant (apart from an oscillation in the reading of 0.1A which is the instrument sensitivity).
The following graph shows the trend of the temperature difference (DT) and of the water temperature before entering the exchanger (Tin).

Before starting to supply electrical power, DT is zero or equal to the sensitivity of the measuring instrument (±0.1°C). Compared to the activation of the switch that starts the delivery of electrical power, the DT begins to increase with a certain delay due to the thermal inertia of the heat exchanger. The DT value stabilizes within a few minutes and its variations subsequent to the initial growth are believed to be attributed to mixing of the water inside the heat exchanger. At the end of the electrical power supply, the same delay in the response of the DT is observed, always induced by the thermal inertia of the heat exchanger.
The measurement of the flow rate of water was carried out at the beginning and at the end of the test. Assuming that the variation of the water flow is linearly dependent on the elapsed time, the trend shown in the graph below is obtained.

By adopting the flow value shown in the graph, the trend of the thermal power output (Wt) and and also the trend of the instantaneous COP as the ratio between the thermal power output and the electrical power input (COP=Wt/We) are calculated. Since it is not possible to calculate the COP value when the electrical power input is zero, in the absence of electrical power it has been chosen to reset the COP value.


Integrating the thermal power output and the electrical power input over time, exchanged energies are determined and the following graph has been obtained from their ratio.

Introduction: "Experiments on cold nuclear fusion and LENR"
NOTES ON THE EXPERIMENT
The reported experiment is the third in a series of tests aimed at characterizing the reaction chamber response to varying conditions. Compared to the previous experiment (Experiment of March 14, 2021) the power supply voltage has been increased and in this way the electrical power input has increased.STIMULATION TYPE
OmissisTESTED MATERIAL
OmissisRESULTS
The first three graphs (click on the image to enlarge it) show the voltage, current and electrical power values measured by the DC power supply.

At the time 00:00:54 (hh:mm:ss) the switch that allows electrical power to reach the setup has been activated and the supply of current has started. At 04:06:15 the same switch was disabled and the power supply was interrupted. The power supply voltage was kept constant for the entire duration of the test while the current is free to vary (driving in voltage limitation). The graphs show that the current and consequently the electrical power increase, reach a maximum and then drop slightly in the first three minutes of delivery and then remain constant (apart from an oscillation in the reading of 0.1A which is the instrument sensitivity).
The following graph shows the trend of the temperature difference (DT) and of the water temperature before entering the exchanger (Tin).

Before starting to supply electrical power, DT is zero or equal to the sensitivity of the measuring instrument (±0.1°C). Compared to the activation of the switch that starts the delivery of electrical power, the DT begins to increase with a certain delay due to the thermal inertia of the heat exchanger. The DT value stabilizes within a few minutes and its variations subsequent to the initial growth are believed to be attributed to mixing of the water inside the heat exchanger. At the end of the electrical power supply, the same delay in the response of the DT is observed, always induced by the thermal inertia of the heat exchanger.
The measurement of the flow rate of water was carried out at the beginning and at the end of the test. Assuming that the variation of the water flow is linearly dependent on the elapsed time, the trend shown in the graph below is obtained.

By adopting the flow value shown in the graph, the trend of the thermal power output (Wt) and and also the trend of the instantaneous COP as the ratio between the thermal power output and the electrical power input (COP=Wt/We) are calculated. Since it is not possible to calculate the COP value when the electrical power input is zero, in the absence of electrical power it has been chosen to reset the COP value.


Integrating the thermal power output and the electrical power input over time, exchanged energies are determined and the following graph has been obtained from their ratio.


Nessun commento:
Posta un commento
Puoi scrivere qui eventuali richieste di chiarimenti, perplessità o il tuo parere su quanto esposto / Please, write here questions, doubts or your opinion on the post